Published on November 22, 2025
Dhaka on a Plate: Can Street Food Become Bangladesh’s Next Scalable Urban Enterprise?
Author: Sonnet Mustafiz, Business Thinker
Dhaka’s street-food industry feeds millions daily and employs tens of thousands in an economy where informal work dominates. Despite its fragmented structure, hygiene challenges, and weak regulation, the sector shows increasing commercial potential. This case examines whether a disciplined, safety-first, semi-formal business model can transform a traditional, low-margin trade into a scalable venture — and what strategic choices an entrepreneur must make to succeed.

Background: A City That Eats on the Move
Dhaka is one of the world’s fastest-growing megacities. With over 23 million residents in the metro area and extreme population density, daily life relies on rapid, affordable, and ready-to-eat food.
Several factors sustain high-frequency demand:
Long commute hours and limited cooking time for office workers.
High student population, especially in Dhaka University, BUET, NSU, IUB, and private institutions.
Cultural demand for snacks and tea across all income segments.
Night-economy dependence, with rickshaw pullers, gig workers, and garment staff eating late.
Seasonal surges, particularly during Ramadan.
Street food is not merely a convenience product; it is an urban infrastructure.
Industry Size & Economic Footprint
Although informal, multiple studies provide clear indicators of scale:
Dhaka has tens of thousands of active street-food vendors across major boroughs (BIP, World Bank).
Street vendors constitute a significant share of informal employment, supporting entire micro-economies (helpers, suppliers, utensil makers, small wholesalers).
Daily consumer reach is estimated at several million interactions.
Vendors report 300–800 units sold/day in high-traffic zones, depending on item.
Gross monthly revenues range from BDT 90,000 to BDT 480,000, depending on location and product mix.
For a low-capital business, the economics are surprisingly robust.
A. Food Safety Weakness
Multiple studies show widespread microbial contamination, poor water quality, and weak knowledge of hygiene protocols among vendors.Yet illness reports remain low — indicating a silent risk and underreporting.
B. Informality & Regulatory Friction
Vendors frequently face:- Unpredictable eviction drives
- Informal payments
- No designated “vending zones” or municipal infrastructure
- Lack of licensing clarity
C. Inconsistent Product Quality
Most stalls depend heavily on the owner’s skill. Systems are rarely documented, making quality inconsistent and preventing scale.D. Thin Margins & Price Volatility
Rising ingredient prices and intense competition contribute to low net margins, especially for untrained operators.The Protagonist’s Challenge
“Can a Scalable, Branded, Safety-First Street Food Company Thrive in Dhaka?”
Imagine an entrepreneur — let’s call him Aref, a 32-year-old marketing professional turned food entrepreneur.
Aref has a vision: build Bangladesh’s first widely-recognized, hygiene-certified, micro-franchised street-food brand.
His hypothesis:
“If customers trust the safety, they will pay a small premium — and we can standardize a business that has remained unstructured for generations.”
To validate his idea, Aref runs a pilot stall in Mirpur DOHS and another near Farmgate. Early results are promising:
Customers willingly pay BDT 5–10 more per item for cleanliness and consistency.
Corporate offices ask for event/iftar catering.
Footfall is steady; early break-even is achieved.
Strategic Analysis: Opportunities & Constraints
Market Opportunities
1. Hygiene-first premiumization: Consumers increasingly value safety due to heightened media coverage of contamination.
A visible hygiene system — gloves, covered utensils, filtered water — builds instant trust.
2. Semi-formal micro-franchising: Vendors want stable income but lack brand power and supply-chain access. A micro-franchise model (low entry fee + standardized kit + training) could ensure consistent quality, reduce supply cost through bulk purchasing, and improve municipal relation
3. Corporate catering & Ramadan expansion: Companies and institutions often require bulk snacks or iftar meals. Street-food flavors with certified hygiene could win these contracts.
Financial Model
Startup Costs (per stall): Stall/Carts & setup: BDT 20,000 – 40,000. Equipment upgrade for premium model: BDT 30,000 – 50,000. Hygiene kit + branding: BDT 3,000 – 8,000. Total: BDT 50,000 – 90,000
Operating Costs (monthly): Ingredients: BDT 15,000 – 40,000. Labor: BDT 12,000 – 28,000. Fuel & utilities: BDT 2,000 – 6,000.
Revenue (monthly): Typical selling: 300–800 units/day. Price: BDT 10–40. Monthly revenue: BDT 90,000 – 480,000
Margin Range: 10–35% net, depending on menu mix and wastage. This economic profile is unusually strong for a micro-enterprise.
Aref’s Strategic Options (Decision Point)
OPTION A — Build a Hygiene-First Street-Food Chain (Owned Outlets)
Pros: Control, higher brand value, consistency
Cons: Capital-heavy, difficult to scale rapidly
OPTION B — Launch a Micro-Franchise Program
Pros: Low capital, strong social impact, scalable
Cons: Maintaining hygiene consistency across franchisees is challenging
OPTION C — Develop a Packaged Food Line for Retail
Pros: High scaling potential, brand extension
Cons: Requires compliance, distribution network, and upfront investment
OPTION D — Create a Street-Food Delivery Platform
Verified vendors + delivery partnership
Pros: Low fixed cost, data-driven model
Cons: Logistics complexity, crowded digital-food market
OPTION E — Focus on B2B Catering
Corporate snacks, event catering, seasonal Ramadan contracts
Pros: High-margin, repeat orders
Cons: Volume risk if corporate budgets tighten
The case asks: Which path offers the highest long-term strategic advantage?
The Untapped Billion-Taka Question
Dhaka’s street food is at an inflection point. What was once purely informal is gradually becoming an urban consumer industry. Hygiene concerns, rising middle-class expectations, and visible demand patterns present real opportunities.
The entrepreneur who cracks the code — through trust, consistency, and scalable systems — can transform a fragmented trade into Bangladesh’s next notable food enterprise.
But the path requires strategic discipline:
formal systems in an informal world.
References
Etzold, B. et al. Street Food Vending in Dhaka: Livelihoods of the Urban Informal Sector, BIP Research.
World Bank Enterprise Survey – Bangladesh Urban Informal Sector Insights (2022).
Dhaka Tribune (2024), “Study finds high bacterial contamination in Dhaka street food.”
Insight Journal (2023), “Food Safety Knowledge and Hygiene Practices among Dhaka Street Vendors.”
Rahman, M.S.U. (2021), Informal Economic Activities in Dhaka, BIP.
Academic and local media reports on Dhaka iftar markets, street-food dynamics, and urban livelihoods.
Published on October 17, 2025
Quantum Computing and the AI Revolution: Strategic Implications and Future Prospects
Author: Sonnet Mustafiz, Business Thinker
Quantum computing and artificial intelligence (AI) represent two of the most transformative technological forces reshaping global industries. While AI has already delivered commercial value across sectors—from drug discovery to autonomous systems—quantum computing remains at a crucial inflection point, transitioning from scientific demonstration to real-world pilot projects. This report explores how these technologies converge, quantifies market opportunities, and identifies strategic implications for corporate decision-makers.
Market Overview
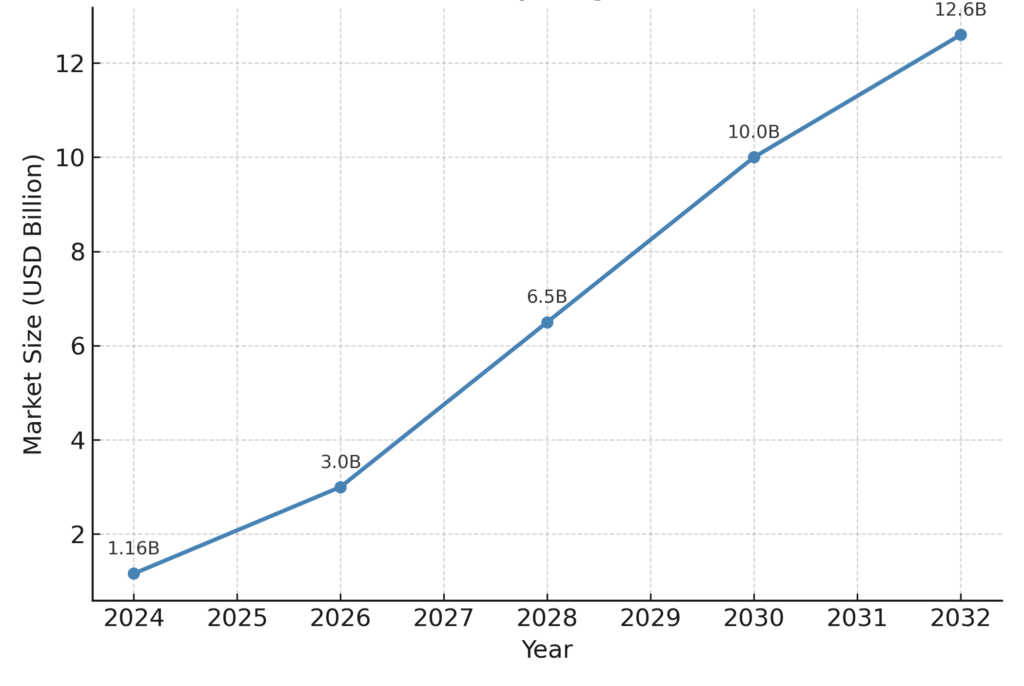
The global quantum computing market is projected to grow from approximately USD 1.16 billion in 2024 to over USD 12.6 billion by 2032, representing a CAGR of nearly 35%. Major players such as IBM, Google, and D-Wave are leading the hardware race, while emerging software startups focus on developing hybrid quantum-classical algorithms. In contrast, the AI market has already surpassed USD 200 billion in annual revenues, growing at a rate exceeding 20% annually. Together, these technologies are expected to redefine competitive advantage through exponential improvements in optimization, simulation, and decision-making capabilities.
Global Quantum Computing Market Growth Forecast (2024–2032)
Several companies have made significant strides in demonstrating quantum and AI convergence:
Google’s Sycamore processor achieved ‘quantum supremacy’ in 2019, performing a computation in 200 seconds that would take classical supercomputers approximately 10,000 years.
IBM’s Quantum Roadmap aims to deliver fault-tolerant quantum systems exceeding 1,000 qubits by 2026, integrated via cloud-based hybrid computing architectures.
Volkswagen partnered with D-Wave to optimize real-time traffic routing in Lisbon, marking one of the first documented commercial pilots for quantum optimization.
DeepMind’s AlphaFold project, while purely AI-driven, demonstrates the value of computational breakthroughs in drug discovery—an area quantum computing is poised to revolutionize further through molecular simulation.
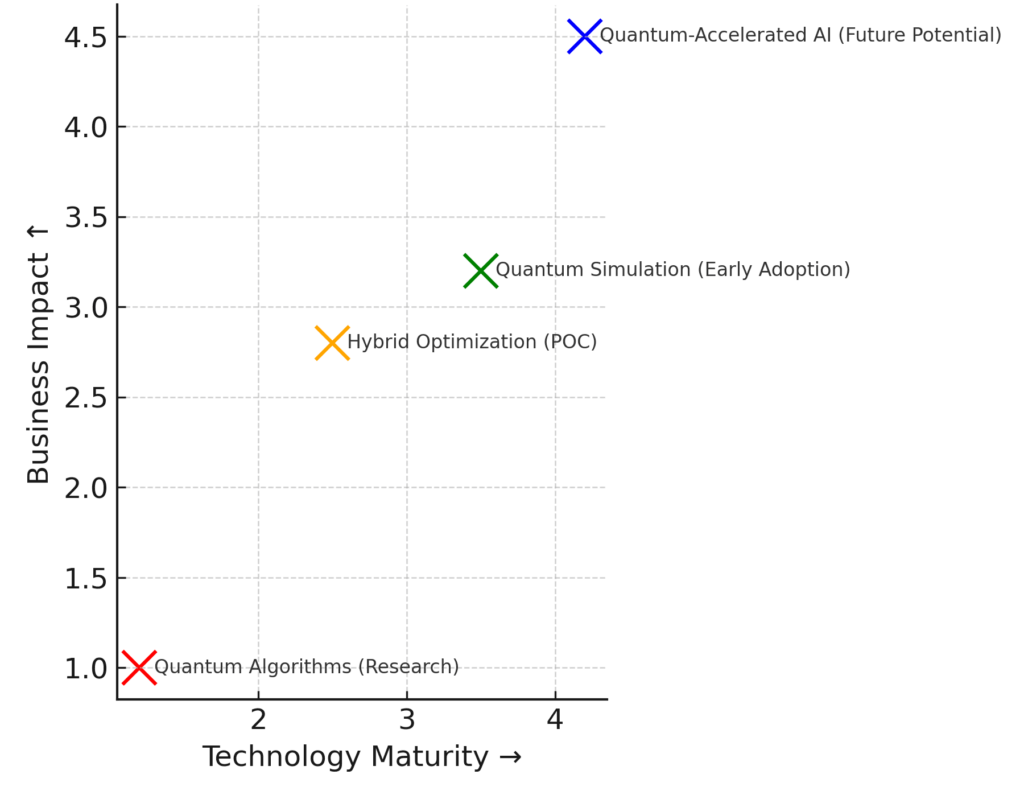
Technology Convergence: Quantum + AI
The intersection of quantum computing and AI promises accelerated machine learning training, enhanced optimization, and novel data modeling capabilities. Near-term opportunities are concentrated in hybrid quantum-classical systems that combine classical GPUs with quantum co-processors to tackle combinatorial problems. Quantum machine learning (QML) research has shown early potential in pattern recognition, anomaly detection, and generative modeling, though scaling remains constrained by hardware noise and limited qubit coherence times.
Global Quantum Computing Market Growth Forecast (2024–2032)
Strategic Implications for Executives
For corporate leaders, the quantum-AI convergence necessitates a three-phase strategic framework:
Explore – Engage in low-cost experimentation using cloud-based quantum access (e.g., IBM Quantum, Amazon Braket) to build familiarity and identify relevant use cases.
Pilot – Develop hybrid proofs-of-concept focused on logistics, materials modeling, or financial risk optimization. Measure ROI using time-to-solution and accuracy metrics.
Scale – As fault-tolerant hardware emerges, integrate quantum algorithms into enterprise-grade analytics platforms to unlock new efficiencies and competitive advantages.
Sectoral Outlook
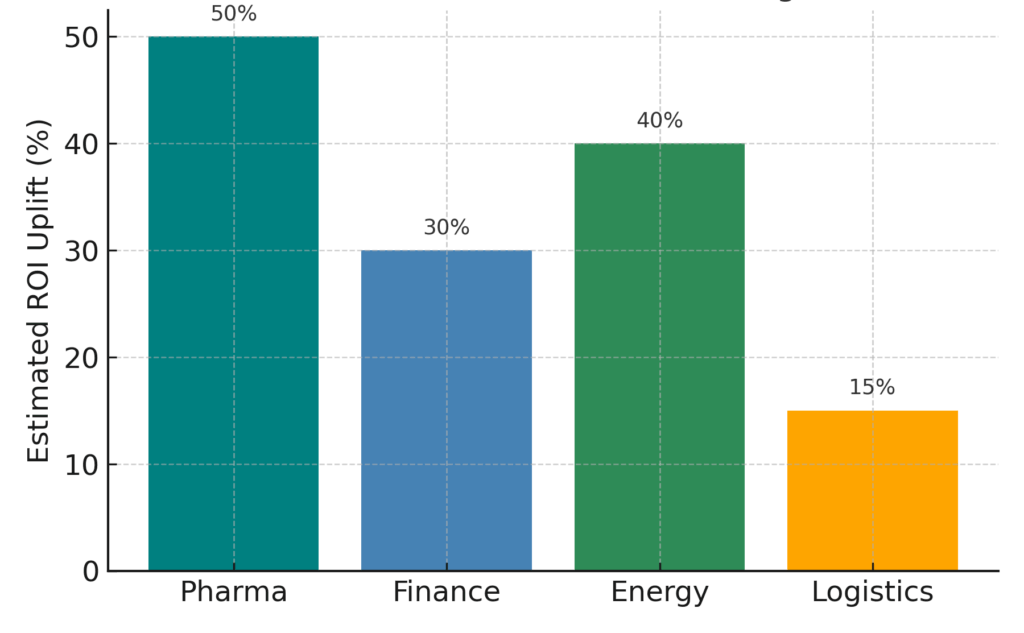
Pharmaceuticals: Combining AI drug screening with quantum simulation could cut discovery timelines by over 50%.
Finance: Quantum algorithms for portfolio optimization and risk modeling may reduce computational cost by orders of magnitude.
Energy: Quantum-enabled AI models could accelerate material design for next-generation batteries and hydrogen catalysts.
Transportation: Continued expansion of quantum optimization will enhance routing, logistics, and supply chain resilience.
Sectoral ROI Potential from Quantum-AI Integration (2030 Projection)
Challenges and Risks
Despite immense promise, several barriers remain:
• High error rates and limited qubit coherence constrain real-world performance.
• Scarcity of quantum-trained professionals and high R&D costs slow adoption.
• Overvaluation risk persists, as many quantum startups remain pre-revenue.
• Continuous classical computing advances may narrow the gap before quantum advantage is achieved.
Strategic Takeaways
The synergy between quantum computing and artificial intelligence represents the next frontier of digital transformation. While AI continues to scale in power and commercial adoption, quantum computing stands on the verge of unlocking new computational paradigms. For strategic leaders, the imperative is clear: invest early in hybrid experimentation, cultivate talent, and monitor technology maturity metrics closely. Those who act now will not only future-proof their organizations but also gain first-mover advantage in industries reshaped by quantum-AI synergy.
Published on October 12, 2025
OpenAI–AMD Strategic Alliance: Redefining AI Compute Competition
Author: Sonnet Mustafiz, Business Thinker
In October 2025, OpenAI and AMD announced a multi-year strategic agreement that will see OpenAI deploy up to 6 gigawatts (GW) of AMD Instinct GPUs, beginning with an initial 1 GW of MI450 chips in late 2026. The deal represents a watershed moment in the AI hardware market, signaling AMD’s arrival as a credible hyperscale supplier and challenging Nvidia’s long-standing dominance. For Intel, the alliance underscores the urgency to accelerate its own AI silicon roadmap and regain market momentum.

Background and Industry Context
The global AI compute market has been characterized by rapid growth and extreme concentration. Nvidia has dominated with its A100, H100, and now B200 accelerators, capturing over 80% market share in 2024. AMD, long a challenger in CPUs and GPUs, has invested heavily in its Instinct series, while Intel has pursued Gaudi accelerators through its 2019 acquisition of Habana Labs.
OpenAI, a pioneer in large language models, has historically relied on Nvidia for training and inference infrastructure. However, increasing supply constraints, pricing pressures, and the need for diversification led OpenAI to pursue additional hardware partnerships. In 2025, it signed a multi-year, multi-generation agreement with AMD for 6 GW of GPU capacity, marking one of the largest compute infrastructure deals ever announced.
Timeline of Major AI Hardware Partnerships
2023 – OpenAI deepens ties with Microsoft Azure and Nvidia for GPT-4 compute.
2024 – AMD launches MI350X; begins limited supply to hyperscalers.
2025 – Intel releases Gaudi3; AMD announces MI450 roadmap.
Oct 2025 – OpenAI and AMD sign a 6 GW multi-year agreement.
2026 – Initial MI450 deployments planned; OpenAI targets multi-vendor optimization.
Strategic Drivers Behind the Partnership
For OpenAI, the deal addresses supply chain resilience, cost optimization, and architectural diversity. AMD’s Instinct GPUs provide competitive performance with more favorable pricing and open software ecosystems. The partnership also enables OpenAI to hedge against potential GPU shortages and strengthen its negotiating leverage with Nvidia.
For AMD, the alliance provides massive validation. Partnering with one of the most influential AI developers positions AMD as a first-tier supplier in the hyperscale market. The deal is projected to generate tens of billions in revenue over its lifetime, boosting investor confidence and accelerating AMD’s software stack maturity.
AI Compute Market Share and Capacity (2023–2027, Estimated)
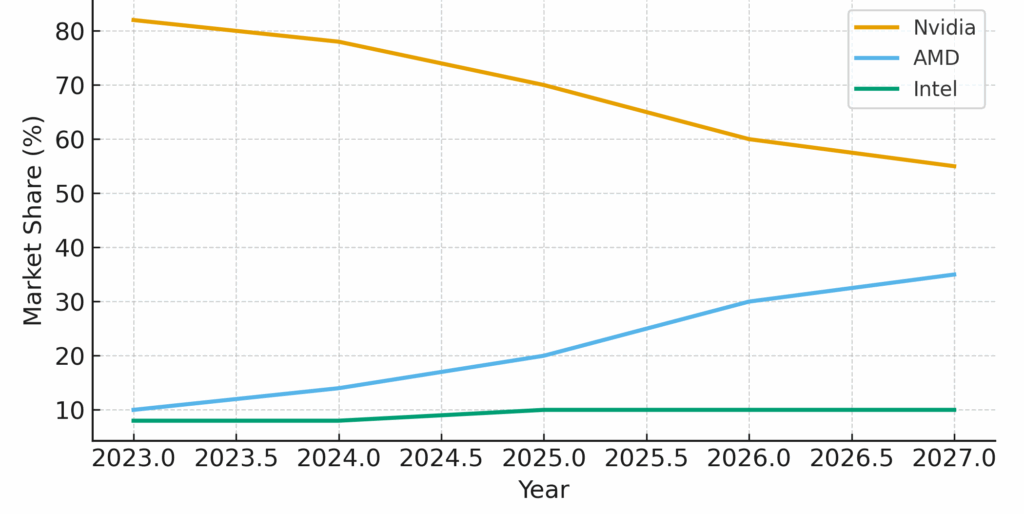
2023: Nvidia 82%, AMD 10%, Intel 8%
2024: Nvidia 78%, AMD 14%, Intel 8%
2025: Nvidia 70%, AMD 20%, Intel 10%
2026 (proj.): Nvidia 60%, AMD 30%, Intel 10%
2027 (proj.): Nvidia 55%, AMD 35%, Intel 10%
Competitive Implications for Nvidia and Intel
Nvidia remains the clear leader in AI accelerators, but AMD’s entry at hyperscale introduces competitive pricing and diversified architecture choices for cloud providers. This may pressure Nvidia’s margins while encouraging innovation in networking, packaging, and efficiency.
For Intel, the AMD–OpenAI deal is a strategic challenge. Intel’s Gaudi3 accelerators have made progress in inference workloads, but they lag in training-scale deployments. Intel must focus on its strengths in CPU-accelerator integration, power efficiency, and cost leadership to regain relevance in AI infrastructure.
Technical Comparison of AI Accelerators
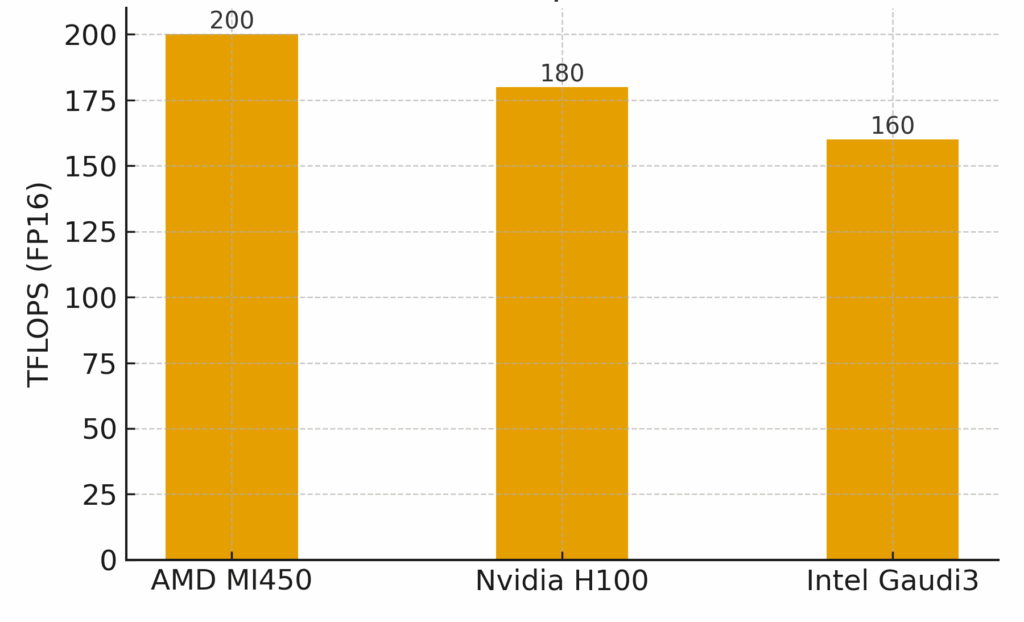
AMD Instinct MI450 – 8nm, 200 TFLOPS FP16, 192 GB HBM3e, open ROCm stack
Nvidia H100 – 5nm, 180 TFLOPS FP16, 160 GB HBM3, CUDA ecosystem
Intel Gaudi3 – 7nm, 160 TFLOPS FP16, 128 GB HBM2e, SynapseAI framework
Risks and Challenges
Execution risk remains significant for both partners. AMD must deliver successive generations of GPUs on schedule and ensure software compatibility for OpenAI’s massive training workloads. OpenAI, in turn, must manage the operational and financial complexities of deploying multi-vendor infrastructure at unprecedented scale. The deal also raises broader questions about power consumption, data center capacity, and sustainability. A 6 GW deployment translates into the energy usage of millions of homes, prompting scrutiny from regulators and investors alike.
Strategic Positioning Matrix
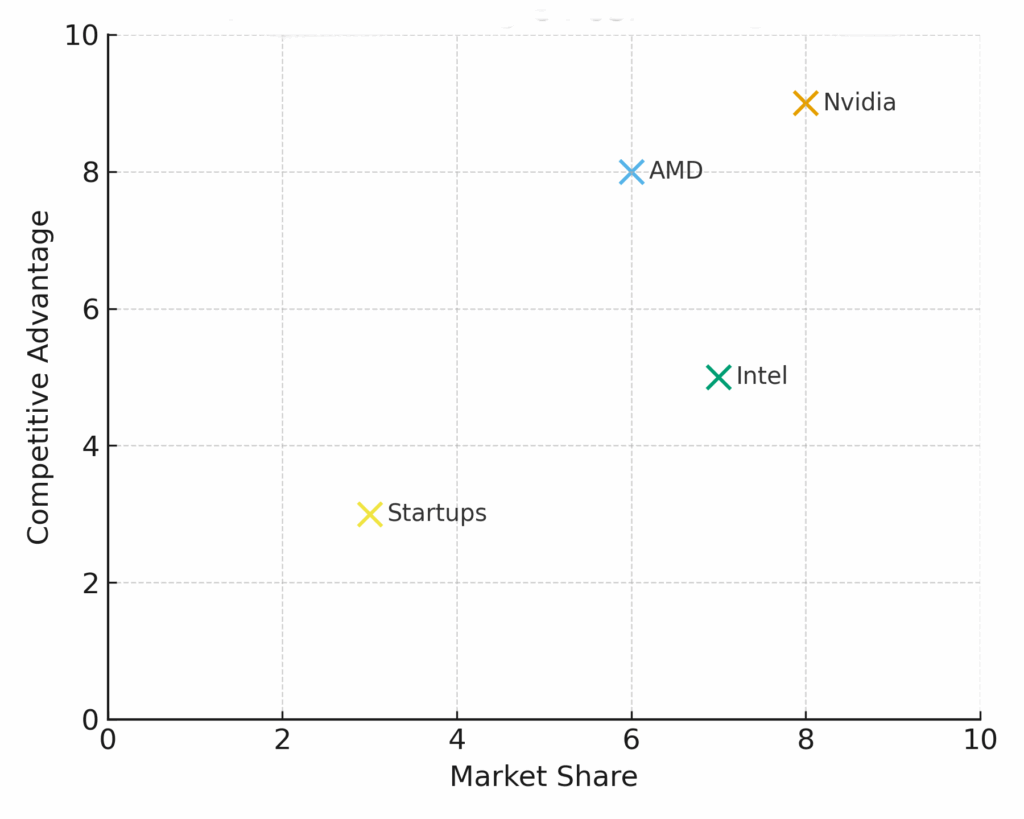
High Market Share, High Advantage – Nvidia (Leadership in ecosystem, software, and performance)
High Market Share, Low Advantage – Intel (CPU leverage but lagging in GPU innovation)
Low Market Share, High Advantage – AMD (Growing rapidly through innovation and partnerships)
Low Market Share, Low Advantage – Startups (Graphcore, Cerebras facing capital intensity)
Future Outlook
The AMD–OpenAI alliance is expected to catalyze a more competitive and diversified AI hardware ecosystem. Analysts forecast that by 2027, AMD’s share of AI compute could surpass 35%, primarily driven by large-scale deployments and an expanding developer ecosystem around ROCm. Nvidia will remain the performance leader, but with moderated margins. Intel’s path forward will depend on whether it can execute on its Gaudi and Falcon Shores roadmaps and rebuild credibility with hyperscale customers.
Published on October 2, 2025
Silicon Symbiosis: NVIDIA & Intel’s Strategic Bet to Reforge AI Computing
Author: Sonnet Mustafiz, Business Thinker

In September 2025 NVIDIA and Intel announced a landmark strategic alliance: NVIDIA will take a multibillion-dollar position in Intel and the two companies will co-develop multiple generations of custom datacenter and PC products that tightly integrate NVIDIA GPUs and Intel CPUs, using new high-bandwidth interconnects and co-packaging approaches. The tie-up is designed to accelerate AI performance at both the datacenter and client (AI-PC) levels, realign supply-chain capabilities, and blunt competitive pressure from vertically integrated hyperscalers and alternative silicon players. [ref.]
Background & industry context
1) The immediate headline
In mid-September 2025 NVIDIA agreed to invest about $5 billion in Intel and to collaborate on co-designed CPU+GPU platforms for data centers and PCs. The public announcements and CEO webcasts emphasized joint roadmaps, custom datacenter CPUs from Intel for NVIDIA packaging, and a proprietary high-speed link to pair x86 CPUs and NVIDIA GPUs more tightly. [ref.]
2) Market dynamics driving the deal
- Explosive data-center GPU demand as AI model sizes and training/inference requirements continue to grow. Industry forecasts project double-digit CAGR for the data-center GPU market through 2030. [ref.]
- Consolidation of the discrete GPU supply: Nvidia’s dominance in discrete GPUs for training/inference has increased significantly through 2024–2025, constraining choices for hyperscalers and enterprises. Recent reports show Nvidia capturing an overwhelming share of discrete GPU shipments in 2025. [ref.]
- Hyperscaler custom silicon: Large customers (Meta, Amazon, Google) are investing in in-house accelerators, creating incentives for NVIDIA to secure closer ties with infrastructure vendors (and for Intel to reassert relevance). [ref.]
Strategic rationale (why the alliance makes sense)
For NVIDIA
- Assured supply chain and scale: Intel’s incumbency in fabs and packaging (and foundry relationships) helps NVIDIA scale capacity and diversify manufacturing risk.
- Stronger CPU-GPU integration: Co-designed Intel CPUs optimized for NVIDIA GPU stacks reduce system latency and improve price/performance for AI workloads — important as customers judge total system economics, not just GPU FLOPS. [ref.]
- Broadened market footprint into AI PCs and client devices by leveraging Intel’s OEM relationships and system design expertise. [ref.]
For Intel
- Relevance in AI servers and AI PCs: Intel gains GPU compatibility and a faster path back into high-growth AI racks dominated by NVIDIA.
- Capital & partner credibility: A large strategic investment from NVIDIA validates Intel’s foundry/packaging strategy and provides funds to accelerate process/package investments. [ref.]
Data center GPU market: historical size and 5-year projection (USD billions) – [Exibit-1]
Year | Reported / Projected Market Size (Data center GPUs) [ref.] |
2024 | 87.3 (approx., industry estimate) — baseline. |
2025 | 120.0 (Markets & Markets projection for 2025 entry point). |
2026 | 136.4 (13.7% CAGR applied) |
2027 | 155.2 (CAGR) |
2028 | 176.4 (CAGR) |
Discrete GPU vendor share (selected datapoints) – [Exibit-2]
Interpretation: NVIDIA’s near-monopoly on discrete GPU shipments for PC/datacenter in 2025 strengthens its bargaining position but also makes NVIDIA sensitive to capacity constraints — a motivation for deeper hardware partnerships. [ref.]
Projected capture of incremental datacenter GPU spend by an NVIDIA-Intel co-stack (scenario analysis) – [Exibit-3]
Assumptions:
- Global incremental GPU market growth from 2025→2028.
- If NVIDIA+Intel co-stack can accelerate adoption by enterprise/hyperscalers through improved TCO, assume conservative capture of 10–20% of incremental market vs. baseline.
Scenario | Incremental market 2025→2028 (USD bn) | Estimated share captured by NVIDIA-Intel | Revenue upside (USD bn) |
Conservative (10%) | 56.4 | 10% | 5.6 |
Aggressive (20%) | 56.4 | 20% | 11.3 |
Market totals from Markets & Markets; capture % is illustrative to show asymmetric upside if co-design improves adoption. [ref.]
Timeline / Gantt (Milestones & expected deliverables) – [Exibit-4]
| Phase | 2025 Q4 | 2026 | 2027 | 2028 |
| Public partnership & investment close | Sep 2025 [ref.] | |||
| Joint roadmap release & reference systems | Q1–Q2 2026 (design wins) [ref.] | |||
| OEM integrations (AI PCs) | Late-2026 (beta) | 2027 (broad OEM shipping) | ||
| Datacenter co-packaged modules (1st gen) | 2026–2027 (alpha/PP) | 2027 (customer trials) | 2028 (scale) | |
| NVLink/Interconnect silicon & certification | 2026 | 2027 | 2028 (scale & feature updates) |
Source: Public announcements and typical enterprise hardware product cadence; used to guide recommended timing expectations. [ref.]
Competitive implications
- For AMD: A tighter NVIDIA-Intel tie up increases competitive pressure in both CPU and GPU fronts — AMD’s advantage in an integrated CPU+GPU supply for AI PCs narrows if the NVIDIA-Intel stack delivers superior AI PC or rack TCO.
- For Hyperscalers: Vertical integration (Meta, Google, Amazon) remains a threat; hyperscalers that have invested in bespoke accelerators will still value multi-vendor flexibility, but the NVIDIA-Intel stack lowers integration overhead for enterprises and some cloud customers. [ref.]
- For Foundries & Packaging Firms: Intel’s foundry/packaging focus is reinforced; partners and third-party foundries (TSMC) will watch how packaging IP and co-design elements shift demand.
Execution risks & mitigation
- Regulatory & antitrust scrutiny — deep cooperation between two industry leaders could invite close regulatory review in multiple jurisdictions. Mitigate: Transparent, pro-competitive commitments, non-exclusive licensing where appropriate.
- Integration complexity — co-designing CPUs + GPUs + interconnects across firms with different engineering cultures is hard. Mitigate: Joint engineering labs, shared roadmaps, and clear API/ABI compatibility guarantees. [ref.]
- Customer lock-in concerns — large enterprises/hyperscalers may resist closed stacks. Mitigate: Offer modular options, open standards compatibility (e.g., CUDA interoperability, industry interconnect standards).
- Hyperscaler self-sufficiency — if major customers accelerate in-house chips, demand could fragment. Mitigate: Provide superior performance per dollar and faster time-to-value (software stack, ecosystem) to remain indispensable. [ref.]
Strategic recommendations
For NVIDIA
- Prioritize system TCO evidence (benchmarks showing end-to-end training/inference cost reduction) to justify adoption to hyperscalers and enterprises.
- Maintain software openness where feasible (e.g., toolchains, drivers), or offer migration pathways to reduce customer lock-in pushback.
- Use portion of strategic investment to secure capacity/packaging throughput that ensures timely supply for 2026–2028 ramp. [ref.]
For Intel
- Leverage OEM relationships to rapidly push AI PCs as a visible early win; focus on co-engineered reference designs for laptops and desktops that showcase on-device generative AI. [ref.]
- Invest in interconnect and co-packaging IP to make the integrated solution technically differentiated and defensible.
For Enterprise / Cloud customers
- Run pilot projects evaluating NVIDIA-Intel co-stacks vs. best-of-breed multi-vendor alternatives; measure end-to-end metrics (latency, throughput, power, TCO).
- Retain architectural optionality (e.g., software that supports heterogeneous accelerators) to hedge hyperscaler or vendor moves.
Conclusion — outlook & scenarios
The NVIDIA-Intel alliance accelerates adoption of tightly integrated CPU+GPU systems in enterprise and AI-PC segments and gives both firms meaningful revenue upside by 2027–28, while leaving room for hyperscalers to continue partial verticalization. Market concentration around NVIDIA GPUs remains high but is somewhat moderated by Intel’s expanded role in system design and packaging. [ref.]
Upside: Faster OEM adoption, strong reference wins, and supply-side improvements produce the aggressive capture figures in Exhibit 3; the alliance becomes the default enterprise AI rack reference. [ref.]
Downside: Regulatory restrictions, failed integration, or hyperscaler in-house acceleration reduce upside; competitive moves by AMD or alternative accelerators fragment the market.
Published on September 30, 2025
Oracle in 2025: A Case Study of Strategic Cloud & AI Ascendance
Author: Sonnet Mustafiz, Business Thinker

By mid-2025, Oracle has transformed its business model from being perceived primarily as a legacy database/software vendor to a heavyweight in cloud infrastructure and AI-enabling services. Through aggressive investment in data centers, securing large cloud contracts, increasing its Remaining Performance Obligations (RPO, i.e., contracted but not yet recognized revenue), and launching AI-integrated products, Oracle is riding a powerful wave of enterprise demand for cloud and AI. Its growth in cloud revenue, especially Infrastructure as a Service (IaaS), is accelerating, and the financials and market signals suggest Oracle is well positioned to challenge incumbents in cloud (e.g., AWS, Azure, Google) for certain workloads. Key strengths include its balance of legacy software support plus cloud infrastructure, multi-cloud database strategy, and scale of committed future contracts. But there are risks: capital intensity, supply / capacity constraints, competition, margin pressures, and execution complexity.
Background & Industry Context
- Cloud computing & AI boom. Global enterprise demand for cloud infrastructure (for storage, data centers, AI training, and inferencing) has been surging. Customers want not just software, but the ability to build, train, and deploy AI models, often requiring GPU clusters, high-performance infrastructure, and secure data pipelines.
- Increasing importance of remaining performance obligations (RPO). In cloud/SaaS businesses, RPO is a key metric for forward revenue visibility: the larger the RPO, the more future recognized revenue is “locked in”.
- Multi-cloud & hybrid cloud demand. Many large enterprises demand flexibility: services that can run across clouds (AWS, Azure, etc.) or move workloads between them, often for regulatory, latency or redundancy reasons.
- Capital expenditure intensity. Building cloud infrastructure is expensive: data centers, GPU servers, networking, power, cooling. Margin pressures are real; scale helps.
Oracle’s position before 2025 had many elements in place: database strength, enterprise relationships, already operating in SaaS (Fusion, NetSuite), some cloud infrastructure. But its cloud IaaS business had lagged the hyperscalers. The question was whether Oracle could scale fast, secure enough contracts, and maintain profitability.
Oracle’s Strategic Moves in 2025
Aggressive CapEx and infrastructure expansion
- Oracle committed substantial investments to double its data center capacity by end of 2025. [ref.]
- Infrastructure investments also aim to satisfy AI-driven demands, especially GPU consumption. Oracle’s GPU usage grew by several hundred percent YoY in Q2 & Q3. [ref.]
Strong contract wins / backlog growth (RPO)
- Oracle’s RPO surged: in Q3 FY25, RPO rose ~62–63% YoY to about US$130 billion. [ref.]
- In Q1 FY26, RPO jumped by ~359% YoY to US$455 billion. [ref.]
- These large contracts include multi-billion dollar deals with top AI players such as OpenAI, Meta, NVIDIA, AMD etc. [ref.]
Cloud revenue acceleration, especially in IaaS
- Total revenue growth has been solid: Q4 FY25 revenues grew ~11% YoY to ~$15.9B. [ref.]
- In that same quarter, cloud (IaaS + SaaS) revenue rose ~27%, with IaaS up ~52%. [ref.]
- SaaS / Applications also grew, though more modestly (~10-15% depending on subsegment). [ref.]
Product innovation & AI integration
- Oracle has advanced its AI Data Platform, vector database capabilities, integration with leading large language models (LLMs), tools for customers to run AI / inference workloads. [ref.]
- High GPU usage for cloud customers, indicating adoption of AI model training/inferencing. [ref.]
Financial discipline and margin management
- While revenues are growing fast, Oracle has tried to maintain margins with non-GAAP operating income growth (for example Q3 FY25 non-GAAP operating margin ~44%) even as it invests heavily. [ref.]
- Cash flow remains strong; operating cash flow in FY25 was ~$20.8B, up ~12%. [ref.]
Forward guidance & expectations
Financial Performance Highlights
| Metric | Recent Value(s) | Growth / Trend |
|---|---|---|
| Total Revenue (FY 2025) | US$57.4B | +8–9% YoY [ref.] |
| Q4 FY25 Revenue | US$15.9B | +11% YoY [ref.] |
| Cloud Services & License Support Revenue (FY25) | ~US$44.0B | +12% YoY [ref.] |
| Cloud (IaaS + SaaS) Q4 growth | ~27% | driven by IaaS (~52%) + SaaS (~12%) [ref.] |
| RPO (remaining performance obligations) | Q3 FY25: ~$130B; Q1 FY26: ~$455B | strong YoY growth, signifies strong future revenue visibility [ref.] |
| Free / Operating Cash Flow | Operating cash flow ~US$20.8B in FY25; positive trending | but free cash flow more volatile due to capex outlays [ref.] |
Competitive Position & Differentiation
Legacy + Cloud Hybrid Strength: Oracle retains dominance in enterprise databases, ERP, and applications (Fusion, NetSuite), which provides a large installed base. By augmenting these with AI, cloud, and infrastructure, Oracle is able to cross-sell and lock in clients.
AI & Infrastructure Push: Oracle is scaling its infrastructure (GPU, data centers) aggressively to capture AI workloads. In many respects, this mirrors strategies of AWS, Microsoft, Google; but Oracle’s differentiator is its database expertise and enterprise relationships.
Multi-Cloud Database Strategy: Oracle is making its databases available across other major cloud providers. This helps reduce customer lock-in fears and expands total addressable market. [ref.]
Backlog Visibility & Contract Scale: The huge increase in RPO gives Oracle greater visibility and confidence in forward revenues; it also signals market trust in Oracle’s ability to deliver large cloud/AI infrastructure projects.
Cost & Margin Management vs CapEx Stress: Although Oracle is spending heavily, it appears to be balancing investment with maintaining reasonable operating margins.
Key Challenges & Risks
- Capital and Infrastructure Scaling Risk: To meet demand, Oracle must continue to build data centers, procure GPUs, power, cooling, etc. Investment is high, and supply chain/component delays (especially for GPUs) can limit the ability to deliver.
- Margin Pressure: Infrastructure is capital-intensive; margins in IaaS are often lower and require scale. As Oracle pushes into infrastructure, the risk is that margins shrink. Non-GAAP vs GAAP metrics will be scrutinized.
- Competition: The biggest cloud players (AWS, Microsoft Azure, Google Cloud) are well ahead in scale. Oracle has to offer differentiated value (price, performance, integration with enterprise data, regulatory/compliance, geography) to win.
- Execution & Delivery Risk: Large contracts bring complexity in execution, potential for cost overrun, regulatory or privacy concerns (especially when AI is involved), customer satisfaction.
- Dependency on AI Hype & Sentiment: Part of Oracle’s valuation and forward guidance depends on continued enterprise demand for AI, continued investment, and willingness of customers to shift workloads to cloud/AI infrastructure. A downturn in AI investment or regulatory pushback could curtail growth.
- Supply Constraints: Limited GPU availability, energy constraints, data center siting, cooling/power costs, and environmental constraints could become binding.
Lessons & Strategic Insights
Backlog or contract commitments (RPO) as a strategic asset. Strong RPO gives visibility, confidence for investment, bargaining power, and greater ability to forecast and scale.
Invest early in infrastructure when you have domain strength. Oracle leveraged its strong base in databases, enterprise applications, and its existing cloud services to justify doubling down on infrastructure; that gave credibility when bidding for large contracts.
AI is not just a technology add-on but a lever for business model transformation. Oracle’s investment in AI training, large scale GPU demand, embedding AI in its cloud and database services, etc., shows that AI gets you more than premium pricing—it can reshape product roadmap and enterprise deals.
Hybrid / multi-cloud flexibility helps win over customers. Enterprises often worry about lock-in, regulatory restrictions, data gravity; offering interoperability with other clouds and hybrid deployment reduces friction.
Maintain financial discipline during growth. Even as Oracle expands its capex footprint, it is keeping track of non-GAAP operating income, cash flows, margins; this helps sustain investor confidence.
Strategic Implications & What Other Firms Can Learn
For incumbents in legacy software: ignoring infrastructure/AI demand risks being disrupted. Oracle’s example suggests that to stay relevant, you must build or partner into infrastructure and AI, not only deliver SaaS.
Cloud providers: competition will increasingly shift from raw capacity to how well you integrate AI, how you manage data security, how you help customers deploy their AI workloads usefully—not just sell compute.
Enterprises (customers): choosing partners with both scale (for infrastructure) and deep domain knowledge (e.g. databases, ERP) can reduce friction, especially as AI models demand large data, tight security, hybrid environments.
Investors: metrics like RPO, IaaS growth, GPU consumption, cloud infrastructure backlog are increasingly leading indicators of where cloud/AI companies will be in 3–5 years, more than perhaps current-quarter GAAP profits.
Outlook to 2026 and Beyond
Oracle in its public guidance expects:
Cloud Infrastructure (OCI) revenue growth of ~70% or more in FY26. [ref.]
Total cloud revenue (SaaS + IaaS) growth rising from ~24% in FY25 to over 40% in FY26. [ref.]
Given the size of RPO (e.g. US$455B in Q1 FY26), a substantial share of future revenue is already under contract. [ref.]
If Oracle executes well, it can become a top factor in the global AI value chain—not just delivering backend infrastructure but being the data/AI platform choice for enterprises.
Conclusion
Oracle’s performance in 2025 showcases a textbook strategic pivot: leveraging core strengths (databases, enterprise software) while aggressively investing in the future (cloud infrastructure, AI). The scale of its contract commitments, growth in IaaS, and guiding metrics position the company for continued momentum. That said, the path ahead demands excellence in execution, cost discipline, and navigating competitive & regulatory headwinds. For business leaders, Oracle’s case underscores the importance of aligning financial investment, product innovation, and market trust.
Published on MAY 4, 2025
BYD vs Tesla: A Customer Value Proposition Perspective
Author: Sonnet Mustafiz, Business Thinker
As the global electric vehicle (EV) market evolves, two major players—BYD and Tesla—have emerged as frontrunners, each with unique strengths and strategic approaches. In recent years, however, BYD’s growth trajectory has outpaced Tesla’s in many key markets, signaling a significant shift in consumer preferences and value perception.

Customer Value Proposition (CVP) is the foundation of any successful brand strategy. It defines how a company creates value for its customers, focusing on aspects like cost, quality, innovation, and service. When analyzing the success of BYD over Tesla, it’s crucial to understand the specific value propositions that have driven consumer choices in BYD’s favor.
BYD’s Competitive Edge
Affordability and Diverse Offerings
One of BYD’s most compelling value propositions is its affordability. Models like the 2023 BYD Dolphin 5-Seater Electric SUV are priced at $18000, significantly lower than the 2024 Tesla Model 3, which costs $34,000. This cost-effective strategy opens up the EV market to a broader demographic, especially in emerging markets.
Additionally, BYD’s diverse range, which includes both Battery Electric Vehicles (BEVs) and Plug-in Hybrid Electric Vehicles (PHEVs), appeals to consumers at different stages of EV adoption. The option to choose between full electric and hybrid models provides a flexible path towards sustainability.
Technological Advancements and Range Efficiency
BYD has made substantial investments in battery technology and charging infrastructure, delivering impressive range capabilities. For instance, the 2025 BYD Dolphin Mini EV boasts a 420km range at a price of BDT $15000, providing exceptional value for cost-conscious consumers.
BYD’s focus on fast-charging solutions further enhances its customer value proposition by reducing wait times and improving convenience for everyday users.
Global Expansion and Local Adaptation
BYD’s strategy to expand manufacturing in regions like Thailand and Hungary supports local economies while minimizing logistical costs. The company aims to sell half of its vehicles outside China by 2030, signifying its commitment to global reach and market adaptation.
This aggressive international growth has been especially successful in Europe and the UK, where BYD’s sales surged by 750% and 631% respectively in early 2025. Such expansion is indicative of a well-structured localization strategy that resonates with regional consumer demands.
Tesla’s Shifting Market Position
Despite its pioneering role in the EV sector, Tesla has faced challenges in maintaining its market dominance:
Higher Pricing: Tesla’s premium positioning, while effective in the early adopter phase, is now being challenged by BYD’s cost-effective models that offer similar, if not better, range and technological features.
Reduced Market Share: Tesla’s market share has notably declined in regions where BYD has aggressively expanded, such as the UK and Germany.
Delayed Product Launches: Postponements in Tesla’s next-generation EVs have allowed BYD to capture market segments seeking innovation and immediate availability.
Before the final verdict, let’s see the BYD vs. Tesla: Growth Comparison (2024–Q1 2025) (Data sourced from quarterly reports, industry estimates)
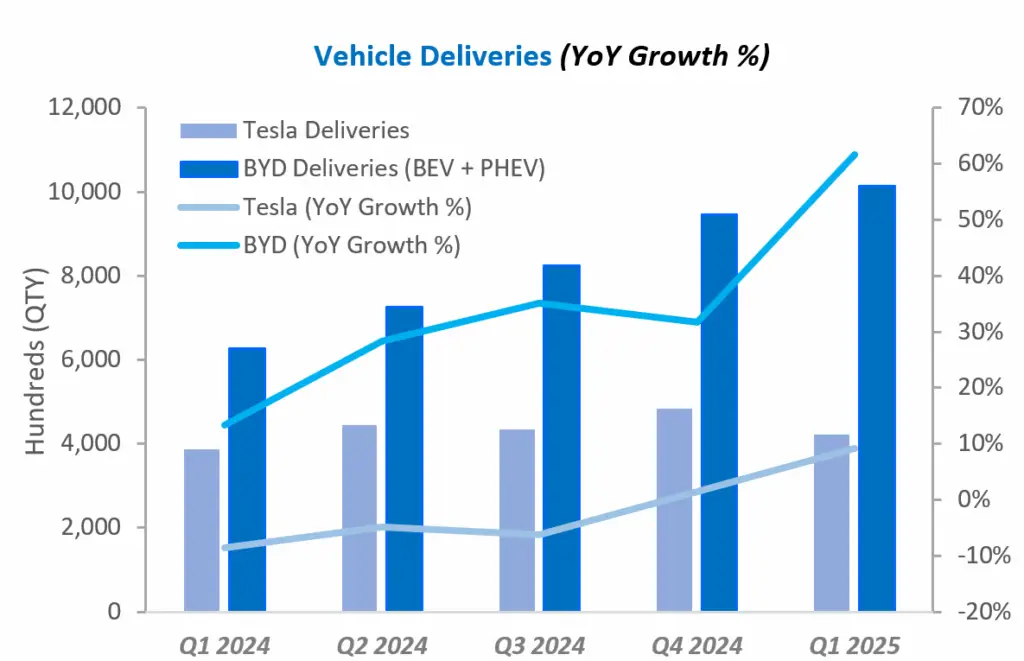
Key Insights:
Tesla had a slow 2024 (declining YoY deliveries) but rebounded slightly in Q1 2025.
BYD maintained >20% YoY growth throughout 2024, with a massive Q1 2025 surge (driven by price cuts in China/SEA).
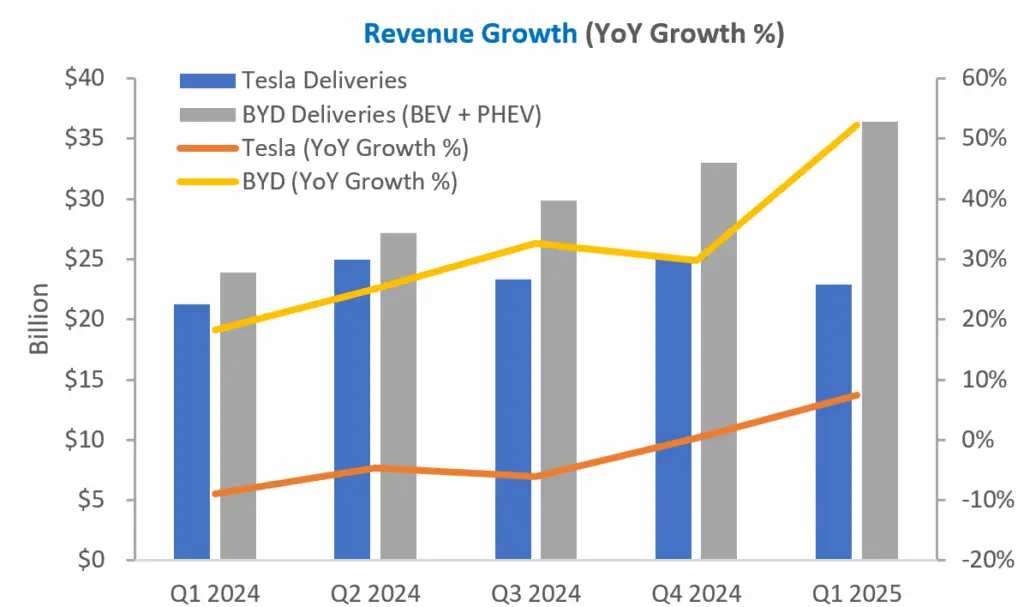
Key Insights:
Tesla’s revenue declined in 2024 (due to price wars, Cybertruck delays) but turned positive in Q1 2025.
BYD’s revenue grew >20% every quarter, exceeding Tesla’s in Q1 2025 for the first time.
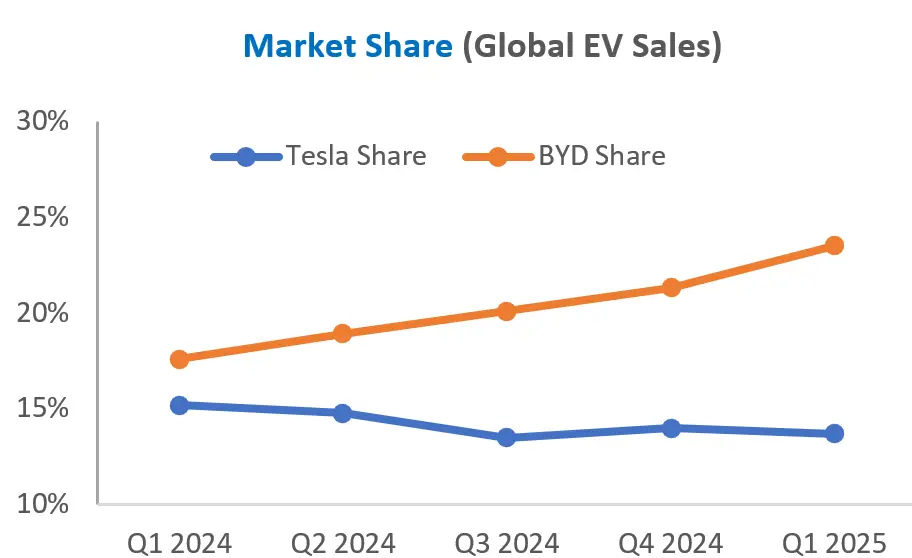
BYD is now the global EV leader (including PHEVs), while Tesla’s share is shrinking.

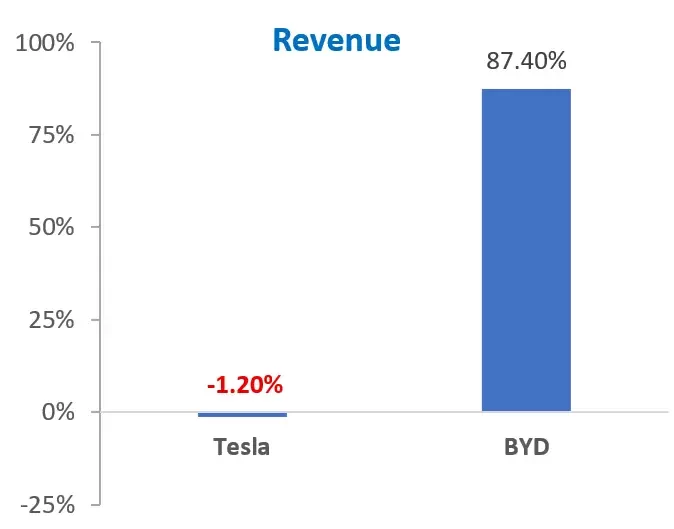
BYD is outpacing Tesla in every category.
Tesla’s Challenges: Demand slowdown in US/EU (aging Model 3/Y, Cybertruck delays). Price cuts hurting margins.
BYD’s Advantages: Dominance in China (50% of its sales). PHEV + BEV mix (Tesla is BEV-only). Aggressive global expansion (Europe, SEA, Latin America).
The Future of EV Leadership: Value Will Decide
In the rapidly evolving EV market, the customer value proposition will remain the primary battleground. BYD’s commitment to affordability, technological innovation, and global market adaptation provides a powerful counter to Tesla’s established brand. As the demand for sustainable and economically accessible EVs continues to grow, BYD’s strategy appears well-positioned to challenge Tesla’s reign—not just in volume, but in value delivered to the consumer.
The next decade may well belong to the automaker that best understands and delivers on its customers’ value expectations. Right now, BYD is making that case compellingly clear.
Published on MAY 28, 2025
Bottled Water’s Rapid Rise in Bangladesh
Author: Sonnet Mustafiz, Business Thinker

Once considered a luxury, bottled water in Bangladesh has quickly become a daily necessity. Driven by public health concerns, rising incomes, and distrust in tap water, the industry has grown into a billion-dollar market. This case study examines the key drivers, competitive dynamics, and regulatory challenges behind the bottled water boom—offering insights into how businesses are reshaping consumer habits in an emerging economy.
Overview & Market Size
Market value: Domestic bottled water is projected to reach US $1.72 billion in 2025, split between US $1.57 billion “at-home” and US $150 million “out-of-home” segments.
Volume: In 2025, combined volumes are around 7.09 billion liters, with per-capita at-home consumption ~39 L.
Annual growth: Estimates show a CAGR of 6–11% (6.17% forecast 2025–29; ~10.7% per StrategyHelix).
Growth Drivers
Public Health Concerns
Tap water issues: Dhaka’s municipal water is not potable without boiling.
Arsenic contamination: Elevated levels in groundwater pose widespread health risks.
Urbanization & Rising Incomes
Robust urban middle class, driven by garments, remittances, and service growth, seeks hygienic and convenient hydration. Lifestyle alignment with global wellness trends encourages the adoption of bottled and premium waters.
Regulatory & Industry Shifts
BSTI now mandates quality control and labeling, raising consumer confidence.
HoReCa, commercial establishments, and transport hubs have become vital distribution channels
Competitive Landscape
Scale of producers: From ~232 registered bottled water firms, the top seven brands control 97% market share.
Leading players: Fresh (24.17%), Pran (17.76%), Aquafina (16.88%), Mum (16.44%), Spa (13.81%), Kinley (4.16%), Jibon (4%).
Multinationals (PepsiCo’s Aquafina, Coca‑Cola’s Kinley) entered in 2014–2016, intensifying competition.
Local giants: Partex, Meghna, Acme, City Group, Dhaka WASA also compete, contributing to brand fragmentation.
Profit Margins & Regulatory Response
Price hikes: BCC found that between Jan–Sept 2023, 500 ml bottles rose from TK 15→20, increasing margins by 212–420% despite marginal cost increases.
Action taken: Lawsuits filed against seven firms (including Coca‑Cola, Transcom, Meghna, Pran) for profiteering; BCC cited collusive pricing.
Distribution impact: Distributors and retailers have seen squeezed margins, while consumers shoulder higher costs.
Socio-Environmental Context
Environmental trade-offs: Bangladesh’s low plastic waste (~0.03 kg/person/day) reflects strict bans (e.g., bags), but bottled water plastic use is rising.
Global parallels: The bottled water boom mirrors global patterns—masking public infrastructure failure and causing environmental externalities.
Strategic Insights & Implications
A. Infrastructure vs. Private Solutions
As long as municipal water safety and groundwater contamination issues persist, demand for bottled water remains inelastic—suggesting private alternatives fill a critical gap.
B. Opportunity for Premium/Functional Products
With growing affluence, there’s room for product innovation: mineral, alkaline, sparkling, or eco‑packaged offerings.
C. Sustainability & Regulation
Balancing profit with responsibility is essential. Companies may consider:
– Introducing refill stations or bulk packaging
– Adopting recycled PET
– Voluntary environmental programs to offset plastic waste.
D. Competitive Dynamics
Market share concentration forces smaller brands to differentiate via price, packaging, or local sourcing. Multinationals bring tech, branding, and supply chain advantages.
Recommendations for Business Leaders
Invest in vertical integration: Control more of the value chain—production, quality, logistics—to streamline pricing and margins.
Launch consumer-centric tiers: Offer economy sachets, mid-tier 500 ml, and premium 2 L/functional variants to serve diverse segments.
Establish sustainability credentials: Eco credentials can strengthen brand reputation and meet emerging regulations.
Collaborate with policymakers: Engage with BSTI/BCC on pricing transparency and innovation-friendly compliance.
Conclusion
Bangladesh’s bottled‑water market has exploded into a US $1.7 billion powerhouse, driven by public health challenges, rising incomes, and consumer trust deficits in tap water. Rapid growth has sparked both entrepreneurial opportunity and regulatory scrutiny. Future success will hinge not only on meeting hydration needs—but doing so through innovation, affordability, and environmental responsibility
| Metric | Value |
|---|---|
| Market revenue (2025 est.) | US $1.72 bn |
| Volume (2025) | 7.09 bn L |
| Per-capita volume | ~39 L/year |
| Growth rate | 6–11% CAGR |
| Number of registered companies | 232 |
| Top‑7 share | 97% |
| Common price change (2023) | TK 15→20 (+33%), margins +212–420% |